F. Wagner February 2005
StateWORKS:
A flowchart is not a state machine
Introduction
There are several methods, models and tools used to describe control systems. Some examples are: state machines, Petri nets, Statecharts, flowcharts. Though they describe the same problems they are not the same thing. Because the state machines are the oldest concept all methods describing sequential systems are sometimes categorized as being equivalent to state machines. This is an obvious misunderstanding which I would like to discuss further, discussing a flowchart as a counterpart of a state machine.
Flowchart
A flowchart is a visual means to show a sequence of some activities. It shows the sequence depending on conditions. Because the wording: sequence, activities and dependencies remind one of similar terms in state machines, flowcharts are sometimes mixed up with state machines. In other words some people do not see the true difference between the two. The confusion starts with the missing understanding of a state which is not known in a flowcharts. To make the matter clear let's first show a simple example.
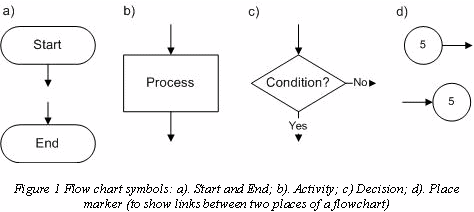
Flowcharts use a few basic symbols shown in Figure 1.

Those symbols will suffice for our example as they are enough for most applications. Interestingly, the graphical tool most often used to produce the flowchart offers 26 symbols plus 44 borders and title types (and probably also the possibility to invent user's own specific symbols which I have not investigated). It is an interesting example of fascination with graphics. We can understand a graphical representation if we understand the symbol used. Who is able to know the meaning of 26 symbols supported by 44 boarders and titles types? Nobody, therefore we use only a part of them. If a reader of our drawing knows another part of the symbols he will not understand our drawing. More does not mean always better.
Example
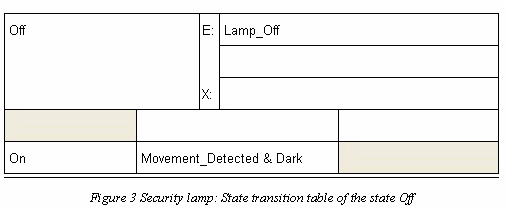
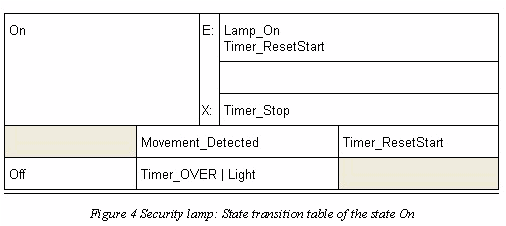
But let's come to our example. We would like to make a flowchart describing the Security lamp control. The lamp should light when movement is detected, and remain lit for, say, 10 seconds after movement ceases. But it should not light in daylight, so it incorporates a sensor of the ambient light level. Using a classical FSM model, we need just two states, the initial Off state and the On state (see Figure 2 through Figure 4). The lamp controller passes to On when movement is detected, but only when the ambient light level is low. An entry action in the On state switches on the lamp, starts a timer and an "input action" re-starts the timer whenever movement is detected. The transition to the Off state occurs when the timer reaches the time-out delay, and also when the ambient light level has increased. The entry action in the state Off switches off the lamp.


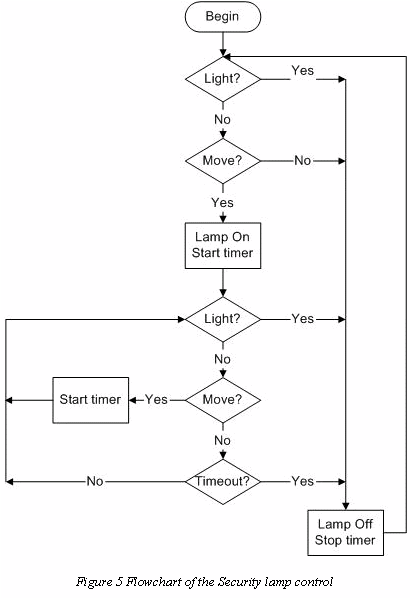
A flowchart that describes the lamp control is shown in Figure 5. The flowchart shows step by step the control sequence: the tested condition and the task to be done depending on the test result. We assume that the sequence has to be repeated endlessly that is reaching the end we have to start it again from the Begin (therefore we do without the End symbol). Though a flowchart is intended for sequences which have clear beginnings and ends, nothing can stop us to use it as we have done in our example. Imagine that we do not like the double existence of "Light?" and "Move?" decision symbols. In other word we would like to have the flowchart more compact.
.
If we wanted to merge the checks we have to distinguish between the beginning (when the lamp is off) and the situation when the lamp is already on. Then we could decide about timeout checks and actions to be done, in other words we need a concept of a state. We could do it introducing a variable which will represent a state but than it is not a flowchart anymore but an invention with the same (dubious) value as markers and flags in coded control systems. But we do it and the result is shown in Figure 6. We assumed in the second solution that switching on already lighting lamp is not a problem and we use a flag timRun to store the information that the lamp is on. If we could get the information from the timer it would be ok but if it is not possible we use a flag and this is a problem. Now imagine that we want to describe not this trivial security lamp problem but some more complex control task where we need several flags (hidden states). Then we end with tens or hundreds flags and we loose our time (and company money) in endless discussion why certain flags have or have not a given value. A flowchart reflects a common practise by coding where flags store information about the past changes of inputs and used resources, like for instance timers.
In a state machine a state represents the information about the past; if the state machine is for instance in a state On we have complete knowledge about the situation: the lamp is on and the time runs. If we look at a certain point in a flow the situation is not clear defined - we have to know the state of all flags to determine the situation; the flags correspond effectively to a coded state.

What is a flowchart for?
Flowcharts were initially introduced to describe program flow. An assembler program was really difficult to read, even if well commented. Hence, a flowchart presentation was a help. Even for high level programming languages it may make sense to describe some program parts in certain situations by means of flowcharts. But also in that case we have to note that they are not a means to describe a program completely. They are a way of getting started, or for documentation, or to explain some concept to the students. We cannot expect that a programmer draws a fully detailed flowchart of a major program before coding it or vice-versa that he prepares a flowchart of a coded program. We are speaking of course about software consisting of more than 1 or 2 pages of code. We may do it for a procedure but can we imagine thousands of pages of flowchart with cross references between pages? A flowchart belongs to innumerable means that fake the reality: as if you can really do something serious with it. In fact, many things in software seems to be treated in that way: to have some value for special occasions (presentations) but in the end only code counts.
Obviously a flowchart is a convenient means. Everybody understands it without any training and it can be drawn without any formal restriction. In other words it is a good tool for informal discussions. It is rather an illusion to expect more. Of course, according to my thesis about overuse expressed in the accompanying newsletter1, there are groups that exploit the concept over any imaginable extend. The procedure is always the same: one intends to use flowchart for some relatively simple tasks and after a while we have a uncontrollable monster and nobody knows how get out of it.
The flowchart concept was a very fruitful idea and can be met in several situations adjusted to the specific needs. Though it lost its common use in code presentations where it has been replaced by a Program Structure Diagram (called also NS diagram from the authors' names: Nassi-Shneidermann) it obviously influences other methods. For instance the Specification and Design Language (SDL) is based on a state machine concept but each state is actually described by a flowchart. Another example is the Unified Modelling Language (UML) where the flowchart is used under the name Activity Diagram.
Sometimes diagrams are drawn which are combinations of flow charts, Petri nets and state transition diagrams, the IEC 61131-3 Sequential Flow Chart being typical in this respect, and these can be very helpful in documenting intentions, but such unholy combinations can be dangerous to use as they discard any theoretical rigour of their various concepts, and they should only be employed for quite simple projects: never for a project which might need to employ tens or more of finite state machines in a structure.
Conclusions
In summary a flowchart can be used to describe a sequence of conditional activities. For certain tasks it is a good tool, for instance to present: a product line, an organization, an intention; in general something that we want to do and we want to explain it to other persons. It is less well qualified to show continuously running sequential activities. The missing concept of state must be then replaced by explicit realisation of all imaginable control paths, which does not make sense except for simple examples in text books. By introducing flags to store the past a flowchart becomes more compact but looses its simplicity and opens the door to dubious inventions which make more harm than good. Hence, descriptions of control problems with flowcharts are possible but the results are much too complex.
And of course, a flowchart describing a sequence of activities is still a flowchart and not a state machine.
1In the Newsletter 1-05 I wrote: We tend to overuse things that we have learned...

 download PDF version